Candlestick Patterns Explained: 10 Important Patterns Every Trader Should Know
Author
admin
Published
November 2, 2026
Category
Candlestick Patterns Explained: 10 Important Patterns Every Trader Should Know
A Complete Beginner’s Guide to Understanding Candlestick Charts in the Indian Stock Market
Candlestick patterns are among the most popular tools used by traders to understand stock price movements. Whether you are learning intraday trading, swing trading or technical analysis, understanding candlestick patterns can help you interpret market behaviour and identify potential trading opportunities.
Every day, thousands of stocks are traded on the National Stock Exchange (NSE) and Bombay Stock Exchange (BSE). Their prices move because of buying and selling activity, market sentiment, company news and economic developments.
Candlestick charts help traders visualise these movements in a simple format.
But what do different candle shapes mean? How can you identify bullish and bearish patterns? Which candlestick patterns should beginners learn first?
In this guide, we will explain 10 important candlestick patterns every trader should know, with examples, chart illustrations and practical trading tips relevant to the Indian stock market.
By the end of this article, you will understand how to identify these patterns and use them as part of a disciplined trading strategy.
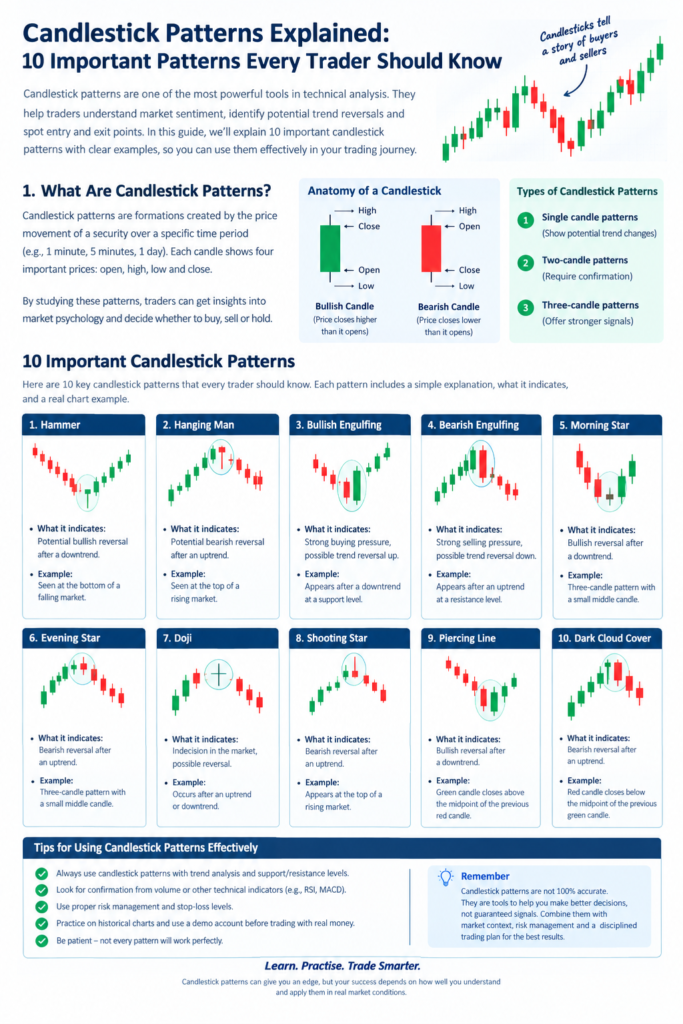
1. What Are Candlestick Patterns?
Candlestick patterns are formations created by the price movements of a stock, index or other financial instrument over a specific period.
A candlestick represents four important price levels:
Open: The price at which the stock started trading during that period.
High: The highest price reached during that period.
Low: The lowest price reached during that period.
Close: The price at which the stock finished trading during that period.
For example, if you select a 5-minute chart, each candle represents five minutes of price movement. On a daily chart, each candle represents one trading session.
Candlestick patterns are formed by one, two or three candles. Traders study their shapes and positions to understand buying pressure, selling pressure and possible changes in market direction.
2. Understanding the Anatomy of a Candlestick
Before learning individual patterns, it is important to understand the basic structure of a candlestick.
A candlestick consists of two main parts:
1. Body
The body represents the difference between the opening and closing prices.
Green candle: Closing price is higher than opening price.
Red candle: Closing price is lower than opening price.
2. Wick or Shadow
The thin lines above and below the body are called wicks or shadows.
Upper wick: Shows the highest price reached.
Lower wick: Shows the lowest price reached.
Bullish and bearish candlesticks
A bullish candle indicates that buyers were stronger during the selected period.
A bearish candle indicates that sellers were stronger during the selected period.
However, one candle alone does not tell the complete market story. Its location, size, volume and surrounding price action are equally important.
3. Types of Candlestick Patterns
Candlestick patterns are generally divided into three categories.
Pattern category | Meaning | Examples |
|---|---|---|
Bullish patterns | May indicate a potential upward reversal or continuation | Hammer, Morning Star |
Bearish patterns | May indicate a potential downward reversal or continuation | Shooting Star, Evening Star |
Neutral patterns | May indicate indecision or uncertainty | Doji |
Understanding these categories makes it easier to interpret price charts and recognise possible market opportunities.
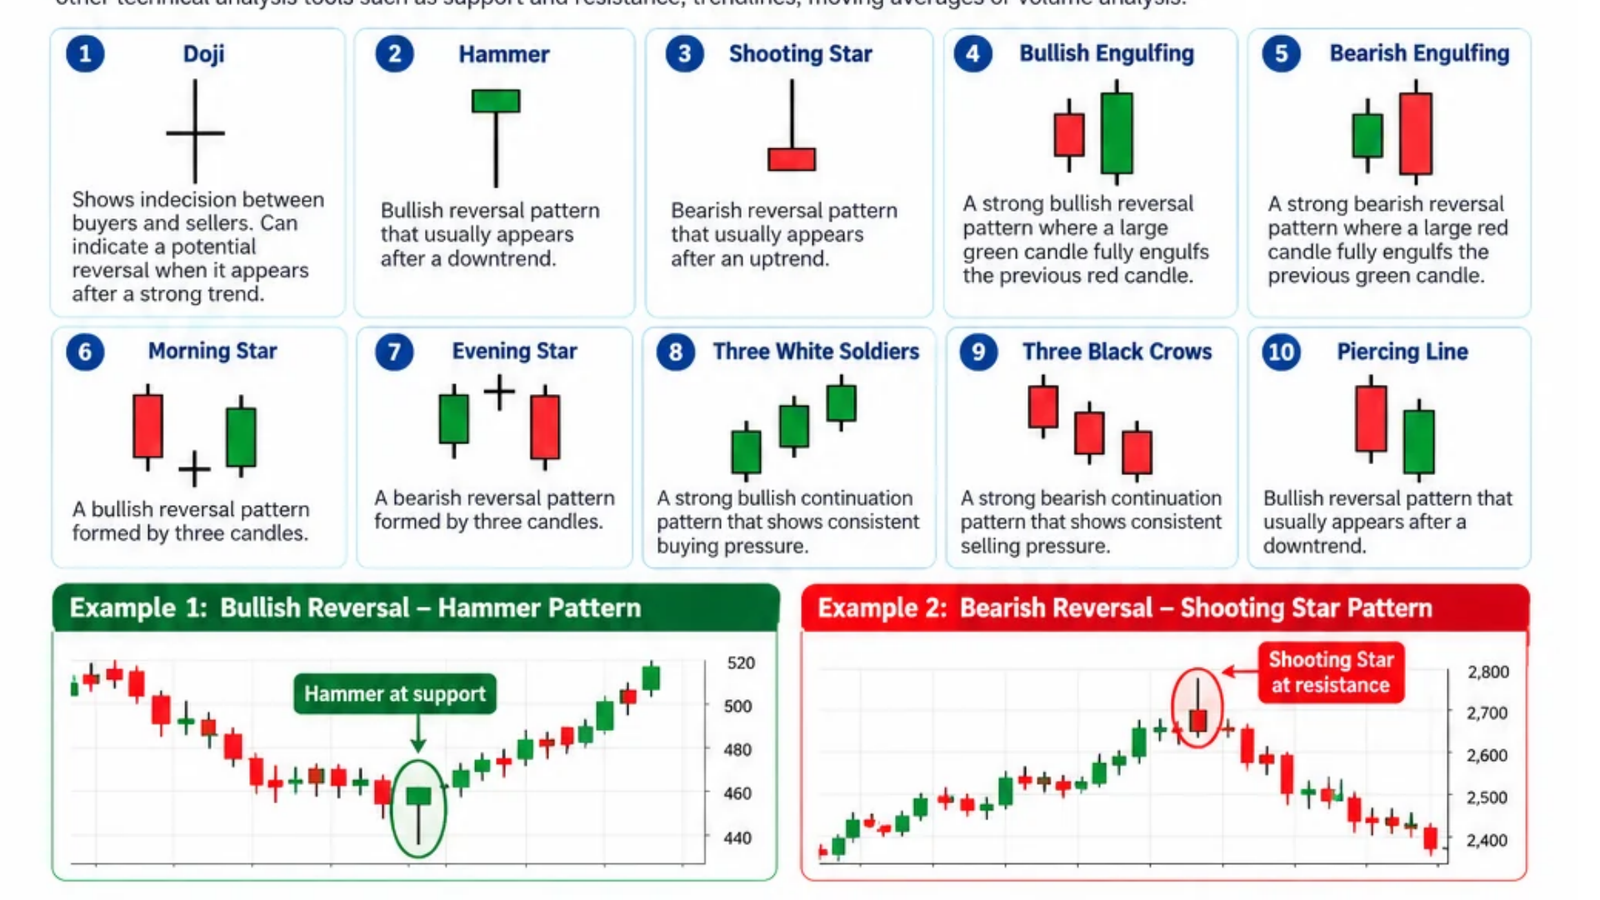
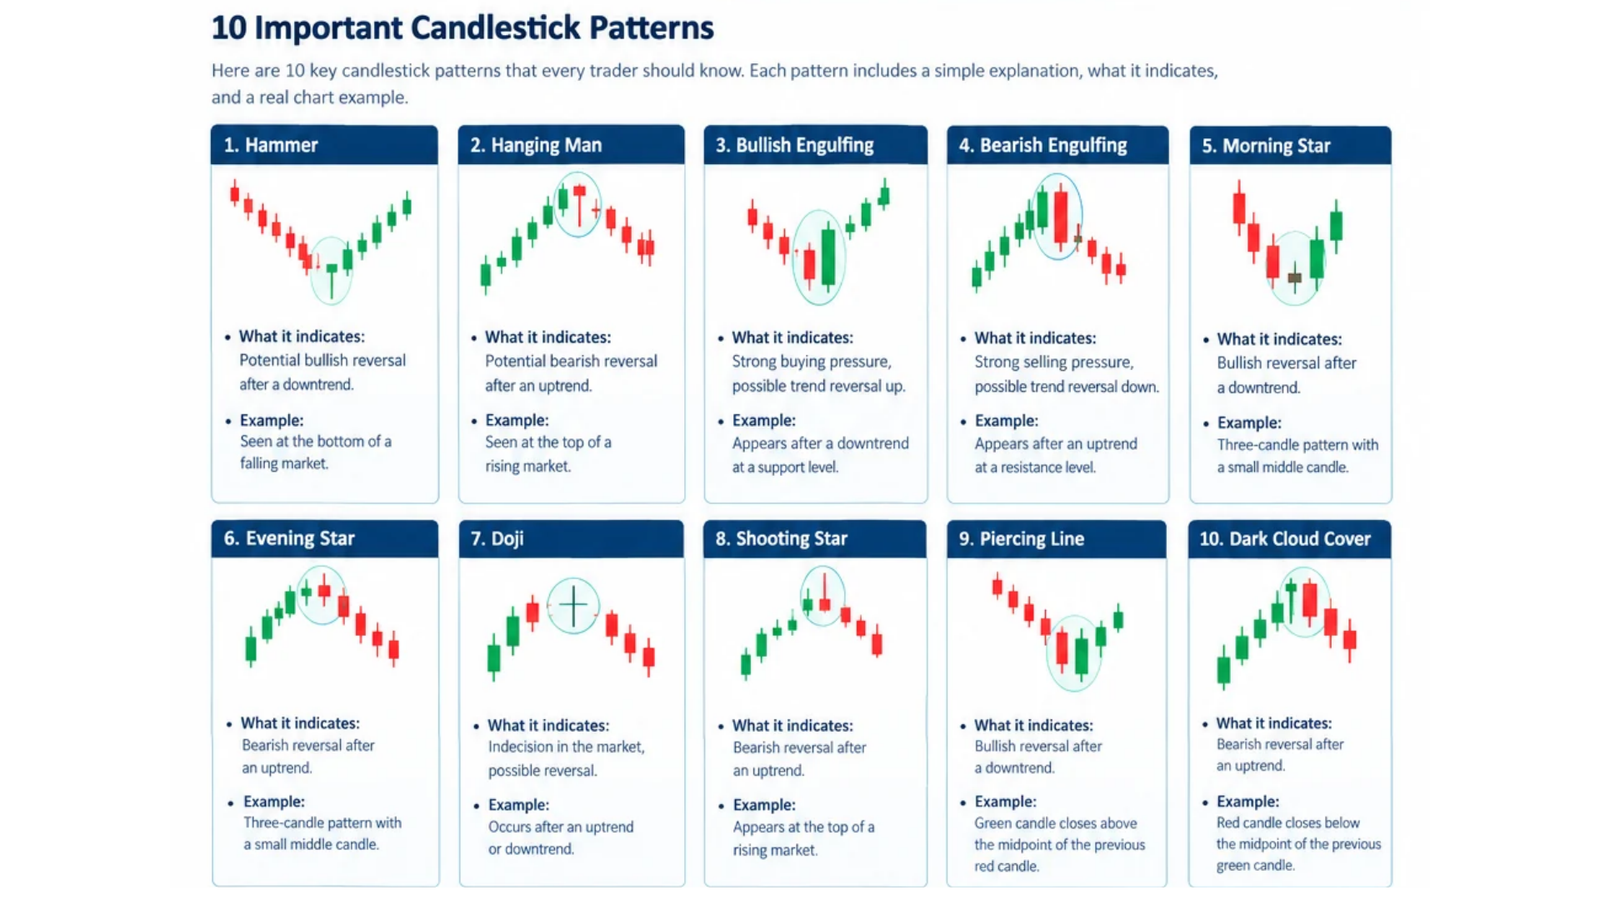
4. 10 Important Candlestick Patterns Every Trader Should Know
Let’s explore ten commonly studied candlestick patterns, their meanings and practical examples.
1. Doji Candlestick Pattern
The Doji is formed when the opening and closing prices of a stock are almost equal. It usually has a very small body, sometimes resembling a cross.
What does it indicate?
A Doji indicates indecision between buyers and sellers. Neither side has established clear control during that trading period.
Example:
Suppose a stock opens at ₹500, moves to ₹510, falls to ₹492 and finally closes at ₹500.
This creates a Doji because the opening and closing prices are almost identical.
How traders use it:
Look for a Doji after a strong upward or downward trend.
Observe the next candle for confirmation.
Check whether the Doji appears near an important support or resistance level.
A Doji alone is not a buy or sell signal. It simply indicates uncertainty.
2. Hammer Candlestick Pattern
The Hammer is a popular bullish reversal pattern that generally appears after a downward price movement.
It has:
A small real body near the top.
A long lower shadow.
A very small or no upper shadow.
The lower shadow is generally at least twice the size of the body.
What does it indicate?
The Hammer suggests that sellers initially pushed the price lower, but buyers entered the market and pushed it back towards the opening price.
This may indicate that buying pressure is increasing.
Example:
Imagine a stock declines from ₹550 to ₹500 over several trading sessions.
At ₹500, a Hammer forms with:
Opening price: ₹505
Highest price: ₹508
Lowest price: ₹480
Closing price: ₹506
The long lower shadow indicates rejection of lower prices.
How traders use it:
Identify the Hammer after a downtrend.
Check whether it forms near a support level.
Wait for the next candle to show bullish confirmation.
Plan an entry only after confirmation.
Place a stop-loss according to the setup and your risk tolerance.
3. Shooting Star Candlestick Pattern
The Shooting Star is the opposite of the Hammer. It generally appears after an upward price movement.
It has:
A small body near the bottom.
A long upper shadow.
A small or no lower shadow.
What does it indicate?
The Shooting Star suggests that buyers initially pushed prices higher, but sellers entered the market and pushed the price back down.
It may indicate weakening buying momentum.
Example:
Suppose a stock rises from ₹700 to ₹750.
A Shooting Star forms with:
Opening price: ₹745
Highest price: ₹775
Lowest price: ₹742
Closing price: ₹746
The long upper shadow indicates that higher prices were rejected.
How traders use it:
Identify the pattern after an uptrend.
Check whether it appears near resistance.
Wait for a bearish confirmation candle.
Consider the potential downside only after evaluating the overall market trend.
Avoid selling immediately after seeing a Shooting Star without confirmation.
4. Bullish Engulfing Pattern
The Bullish Engulfing pattern consists of two candles.
The first candle is bearish, followed by a larger bullish candle whose real body completely engulfs the previous candle’s real body.
What does it indicate?
It indicates a possible shift in market sentiment from selling pressure to buying pressure.
The second candle suggests that buyers have become more aggressive.
Example:
Suppose a stock is trading around ₹400 after a continuous decline.
Candle | Opening | Closing |
|---|---|---|
First candle (red) | ₹405 | ₹395 |
Second candle (green) | ₹390 | ₹410 |
The second candle’s body covers the first candle’s body, forming a Bullish Engulfing pattern.
How traders use it:
Look for the pattern after a downtrend.
Check for formation near support.
Observe whether trading volume increases.
Consider entering after the pattern is complete and the market confirms the upward move.
5. Bearish Engulfing Pattern
The Bearish Engulfing pattern is the opposite of the Bullish Engulfing pattern.
It consists of a small bullish candle followed by a larger bearish candle that completely engulfs the previous candle’s real body.
What does it indicate?
The pattern suggests that sellers have gained control over buyers, potentially indicating a downward reversal.
Example:
Suppose a stock has been moving upward and is trading around ₹600.
Candle | Opening | Closing |
|---|---|---|
First candle (green) | ₹590 | ₹600 |
Second candle (red) | ₹605 | ₹585 |
The second candle completely covers the first candle’s body.
This creates a Bearish Engulfing pattern.
How traders use it:
Identify it after an upward trend.
Check whether it forms near resistance.
Observe volume and the next candle.
Look for a potential bearish setup after confirmation.
6. Morning Star Pattern
The Morning Star is a three-candle bullish reversal pattern that generally forms after a downward trend.
It consists of:
First candle: A strong bearish candle.
Second candle: A small-bodied candle showing indecision.
Third candle: A strong bullish candle.
What does it indicate?
The pattern suggests that selling pressure is weakening and buyers may be gaining control.
Example:
Imagine a stock declines from ₹1,000 to ₹900.
The following three candles form:
Candle | Opening | Closing |
|---|---|---|
First (bearish) | ₹950 | ₹920 |
Second (small body) | ₹915 | ₹913 |
Third (bullish) | ₹915 | ₹940 |
The third candle closes well into the first candle’s body, indicating a possible shift in sentiment.
How traders use it:
Identify the pattern after a downtrend.
Check for support near the pattern.
Look for strong bullish participation in the third candle.
Use the pattern’s low as a reference when planning risk.
7. Evening Star Pattern
The Evening Star is the opposite of the Morning Star.
It is a three-candle bearish reversal pattern that generally appears after an upward trend.
It consists of:
First candle: A strong bullish candle.
Second candle: A small-bodied candle showing indecision.
Third candle: A strong bearish candle.
What does it indicate?
The pattern suggests that buying momentum may be weakening and selling pressure may be increasing.
Example:
Suppose a stock rises from ₹800 to ₹900.
Candle | Opening | Closing |
|---|---|---|
First (bullish) | ₹850 | ₹880 |
Second (small body) | ₹885 | ₹887 |
Third (bearish) | ₹880 | ₹850 |
The third candle moves significantly into the first candle’s body, indicating potential bearish momentum.
How traders use it:
Look for it near resistance.
Confirm that the preceding trend was upward.
Observe the third candle’s closing price.
Consider a bearish setup only after assessing the broader market.
8. Three White Soldiers Pattern
Three White Soldiers is a bullish pattern consisting of three consecutive strong bullish candles.
The pattern generally forms after a downtrend or a period of consolidation.
Characteristics:
Three consecutive bullish candles.
Each candle generally closes higher than the previous one.
The candles have relatively strong bodies.
Their opening prices are generally within or near the previous candle’s body.
What does it indicate?
The pattern suggests sustained buying pressure and may indicate a potential upward reversal or continuation.
Example:
A stock moves as follows:
Trading session | Opening | Closing |
|---|---|---|
Day 1 | ₹300 | ₹310 |
Day 2 | ₹308 | ₹320 |
Day 3 | ₹318 | ₹332 |
The three consecutive bullish candles show increasing buying interest.
How traders use it:
Identify the pattern after a decline or consolidation.
Check whether the candles have healthy bodies.
Observe trading volume.
Avoid chasing the price if the stock has already moved significantly.
9. Three Black Crows Pattern
Three Black Crows is the opposite of Three White Soldiers.
It consists of three consecutive bearish candles, generally appearing after an upward trend.
Characteristics:
Three consecutive bearish candles.
Each candle generally closes lower than the previous one.
The candles have relatively strong bodies.
The opening prices are generally within or near the previous candle’s body.
What does it indicate?
The pattern indicates sustained selling pressure and may suggest a potential downward reversal.
Example:
Suppose a stock is trading around ₹500 after an extended upward movement.
Trading session | Opening | Closing |
|---|---|---|
Day 1 | ₹500 | ₹490 |
Day 2 | ₹492 | ₹480 |
Day 3 | ₹482 | ₹468 |
Three consecutive bearish candles indicate that sellers are dominating the market.
How traders use it:
Identify the pattern after an upward trend.
Check whether it forms near resistance.
Observe the overall market direction.
Avoid short-selling after an already extended downward move without a proper trading plan.
10. Piercing Line Pattern
The Piercing Line is a two-candle bullish reversal pattern that generally forms after a downward trend.
It consists of:
First candle: A strong bearish candle.
Second candle: A bullish candle that opens below the previous close and closes above the midpoint of the first candle’s body.
In markets where price gaps are uncommon, the exact textbook opening-gap condition may be less frequent. Traders should focus on the overall structure and confirmation rather than forcing a perfect textbook formation.
What does it indicate?
The pattern suggests that buyers are entering the market and recovering a significant portion of the previous session’s losses.
Example:
Suppose a stock is trading around ₹400.
Candle | Opening | Closing |
|---|---|---|
First (bearish) | ₹410 | ₹390 |
Second (bullish) | ₹385 | ₹403 |
The second candle closes above the midpoint of the first candle’s body (₹400), creating a Piercing Line pattern.
How traders use it:
Look for it after a downtrend.
Check for formation near support.
Observe whether the second candle has strong buying volume.
Wait for additional confirmation before considering a trade.
5. Quick Reference: 10 Candlestick Patterns
Use this table as a quick revision guide while analysing stock charts.
Pattern | Type | Candles | Typical market context |
|---|---|---|---|
Doji | Neutral | 1 | Indecision |
Hammer | Bullish | 1 | After a downtrend |
Shooting Star | Bearish | 1 | After an uptrend |
Bullish Engulfing | Bullish | 2 | After a downtrend |
Bearish Engulfing | Bearish | 2 | After an uptrend |
Morning Star | Bullish | 3 | After a downtrend |
Evening Star | Bearish | 3 | After an uptrend |
Three White Soldiers | Bullish | 3 | After a decline or consolidation |
Three Black Crows | Bearish | 3 | After a rally or consolidation |
Piercing Line | Bullish | 2 | After a downtrend |
6. How to Use Candlestick Patterns in Intraday Trading
Knowing candlestick patterns is only the first step. You must also understand how to apply them in real trading situations.
Here is a simple example.
Suppose you are analysing a stock on a 5-minute NSE chart.
You notice the following:
The stock has been declining since market opening.
It reaches an important support area around ₹500.
A Hammer pattern forms near the support level.
The next candle closes above the Hammer’s high.
Trading volume increases during the confirmation candle.
This combination may indicate a potential bullish trading opportunity.
An illustrative trading plan could be:
Trading element | Price |
|---|---|
Entry price | ₹506 |
Stop-loss | ₹498 |
Target | ₹522 |
Risk per share | ₹8 |
Potential reward | ₹16 |
Risk-reward ratio | 1:2 |
This example demonstrates how traders can combine candlestick patterns with support, resistance and risk management.
The setup is not guaranteed to succeed. Actual execution prices, brokerage and slippage can affect the result.
7. Five Important Tips for Using Candlestick Patterns Effectively
1. Always consider the market trend
A Hammer is generally more meaningful after a downtrend than in the middle of a sideways market.
2. Combine patterns with support and resistance
Patterns forming near important price levels can provide more useful context.
3. Check trading volume
Higher volume can help confirm participation behind a price movement. However, volume alone does not guarantee a successful trade.
4. Wait for candle confirmation
Avoid taking trades before the pattern is complete. A candle can change shape before its timeframe closes.
5. Practise before trading with real money
Use historical charts and paper trading to understand how frequently patterns fail and how your strategy performs.
8. Common Mistakes Beginners Should Avoid
Many beginners misunderstand candlestick patterns and use them incorrectly.
Avoid these mistakes:
Treating every Hammer as a buy signal.
Selling immediately after seeing a Shooting Star.
Ignoring the overall market trend.
Trading without a stop-loss.
Ignoring trading volume and support or resistance.
Using too many technical indicators.
Entering trades before a candle closes.
Assuming that a particular pattern guarantees profits.
Remember that candlestick patterns are tools for interpreting market behaviour, not guaranteed predictions of future prices.
9. Frequently Asked Questions (FAQs)
Q1. Which candlestick pattern is best for beginners?
Hammer, Shooting Star, Bullish Engulfing and Bearish Engulfing are useful starting points because their structures are relatively easy to identify. Beginners should learn their market context and confirmation requirements.
Q2. Are candlestick patterns reliable?
Candlestick patterns can help traders interpret market sentiment, but they are not always reliable. Their usefulness depends on market conditions, trend direction, trading volume and the price levels where they appear.
Q3. Which timeframe is best for candlestick patterns?
It depends on your trading style.
5-minute and 15-minute charts: Commonly used by intraday traders.
1-hour charts: Useful for studying short-term trends.
Daily charts: Commonly used by swing traders and positional traders.
Beginners can start with daily charts before moving to shorter timeframes.
Q4. Can I use candlestick patterns for Nifty 50 and Bank Nifty?
Yes. Candlestick patterns can be studied on Nifty 50 and Bank Nifty charts, as well as individual stocks. However, index movements can be influenced by multiple constituent stocks and broader market conditions.
Q5. Can candlestick patterns be used alone?
It is generally better to combine them with other tools such as support and resistance, volume, moving averages and RSI. A complete trading plan should also include entry conditions, stop-loss placement and position sizing.
Conclusion
Candlestick patterns are an important part of technical analysis and can help traders understand the relationship between buyers and sellers.
Learning the ten patterns explained in this guide will give beginners a foundation for reading stock charts and identifying potential trading opportunities.
However, memorising candle shapes is not enough. You must understand the market trend, price action, trading volume and important support and resistance levels.
Start by learning a few patterns, practise identifying them on historical charts and maintain a trading journal to evaluate your decisions.
Remember: Successful trading is not about identifying every candlestick pattern. It is about understanding the market, managing risk and following a disciplined trading strategy.
Want to improve your stock market knowledge? Explore our stock trading courses and learn technical analysis, chart reading, intraday trading and risk management step by step.
Disclaimer: This article is for educational purposes only and does not constitute investment advice or stock recommendations. Candlestick patterns do not guarantee market direction or profits. Trading involves financial risk, and you should understand those risks before making trading decisions.
SEO publishing details
Recommended image placement
You have two infographic visuals generated for this article:
Place the candlestick anatomy and 10-pattern infographic immediately after Section 2.
Place the second candlestick-pattern cheat sheet after Section 4 as a visual revision guide.
Image alt text:
candlestick anatomy showing bullish and bearish candles10 important candlestick patterns explained with chart examples
Suggested image file names:
candlestick-patterns-anatomy-guide.png10-important-candlestick-patterns.png
SEO keywords to include naturally:
Candlestick patterns
Candlestick patterns for beginners
Bullish candlestick patterns
Bearish candlestick patterns
Best candlestick patterns for intraday trading
How to read candlestick charts
Technical analysis for beginners in India
Research references
The article’s pattern descriptions and technical explanations are informed by:
NSE and BSE – Candlestick Analysis educational PDF.
Toto Togel+1
Angel One – Powerful Candlestick Patterns.
Angel One
IG – 16 Candlestick Patterns Every Trader Should Know.
IG AU
Binance Academy – How to Read the Most Popular Candlestick Patterns.
Binance
Publishing tip: Make this a cornerstone technical-analysis article and internally link it to your articles about intraday trading, support and resistance, price action strategies and risk management. This helps readers move from basic chart knowledge towards your trading courses.
Related Post
Apply to Join My Trading Challenge
Apply to Join My Trading Challenge




Join 584700+ traders inside

Subscribe to our newsletter and we will keep you informed about upcoming webinars, news, events and updates to our products.
Home
Copyright © 2024 Traderoom | Powered by Onecontributor