How to Start Intraday Trading in India: Step-by-Step Guide for Beginners
Intraday trading has become increasingly popular among people interested in the Indian stock market. Many beginners are attracted to the idea of buying and selling shares within a single trading day and potentially earning profits from short-term price movements.
However, intraday trading is not as simple as buying a stock when its price rises and selling it when the price falls. It requires market knowledge, technical analysis, discipline, proper planning and effective risk management.
If you are a beginner wondering how to start intraday trading in India, this guide will help you understand the basics, open the necessary accounts, select stocks, read charts, develop a trading strategy and manage your risks.
Let’s explore the process step by step.
1. What Is Intraday Trading?
Intraday trading is a type of stock market trading in which traders buy and sell shares within the same trading day. The objective is to benefit from short-term price movements without holding the position overnight.
For example, suppose you purchase 50 shares of a company at ₹200 per share in the morning.
Buying price: ₹200
Number of shares: 50
Total purchase value: ₹10,000
Selling price: ₹205
Total selling value: ₹10,250
Gross profit: ₹250
In this example, you earn a gross profit of ₹250 before brokerage, taxes and other applicable transaction charges.
Similarly, if the share price falls to ₹195 and you sell your position, your gross loss would be ₹250.
Intraday traders generally use price charts, technical indicators, market trends and trading strategies to identify potential buying and selling opportunities.
Important: Intraday trading involves substantial financial risk. Profits are not guaranteed, and traders can lose money quickly, particularly when using borrowed exposure or leverage.
2. Understand How the Indian Stock Market Works
Before starting intraday trading, you should understand the basic structure of the Indian stock market.
India has two major stock exchanges:
NSE (National Stock Exchange): One of India’s leading stock exchanges, where shares of many listed companies are traded.
BSE (Bombay Stock Exchange): One of India’s oldest stock exchanges, offering trading in listed securities.
Most beginners start by learning about the Nifty 50 and Sensex.
Nifty 50: An index representing 50 major companies listed on the NSE.
Sensex: An index representing 30 major companies listed on the BSE.
These indices help traders understand the broader direction of the Indian stock market.
For example, if Nifty 50 is moving upward with strong buying activity, it may indicate positive market sentiment. However, not every stock will necessarily move in the same direction.
Understanding market indices helps traders avoid making decisions based only on individual stock movements.
3. Open a Demat and Trading Account
To start trading in Indian stocks, you need the appropriate accounts.
Demat account
A Demat account holds shares and other eligible securities in electronic form.
Trading account
A trading account allows you to place buy and sell orders through a stockbroker.
You also need a bank account for transferring money to and from your trading account.
Documents generally required
PAN card
Aadhaar or other accepted identity and address proof
Bank account details
Mobile number
Email address
Photograph, if required
How to open an account
Choose a SEBI-registered stockbroker.
Visit the broker’s official website or application.
Complete the account-opening and KYC process.
Submit the required documents.
Complete any verification requirements.
Activate your trading account and understand the broker’s trading platform.
Before selecting a broker, compare brokerage charges, transaction costs, platform reliability, customer support and available trading features.
Never choose a broker simply because it advertises the highest leverage or lowest charges.
You can also refer to the SEBI Investor website for information about trading and Demat accounts.
4. Learn Indian Stock Market Trading Timings
Understanding market timings is important because intraday traders must manage their positions within the applicable trading session.
For the regular NSE equity market, the normal trading session is generally:
| Session | Timing |
|---|---|
| Pre-open session | 9:00 AM – 9:15 AM |
| Regular market opening | 9:15 AM |
| Regular market closing | 3:30 PM |
The regular equity trading session generally operates Monday to Friday, excluding exchange holidays.
Some securities and market segments may have different session arrangements or closing-auction rules. Always check the latest exchange and broker instructions.
Important market periods
Market opening (9:15 AM – 10:00 AM)
Prices can move quickly as the market reacts to overnight global developments, news and opening orders. Beginners should avoid entering trades without a clear plan.
Midday session (11:00 AM – 2:00 PM)
Trading activity may slow down in some stocks. Traders should avoid taking unnecessary positions simply because they want to remain active.
Market closing period (2:30 PM – 3:30 PM)
Trading activity can increase as traders adjust their positions before the end of the session.
As a beginner, focus on understanding price behaviour rather than trying to trade during every market period.
5. Learn the Basics of Technical Analysis
Technical analysis is one of the most important skills for intraday traders.
It involves studying historical price movements, trading volume and chart patterns to identify potential trading opportunities.
Here are some essential technical analysis concepts.
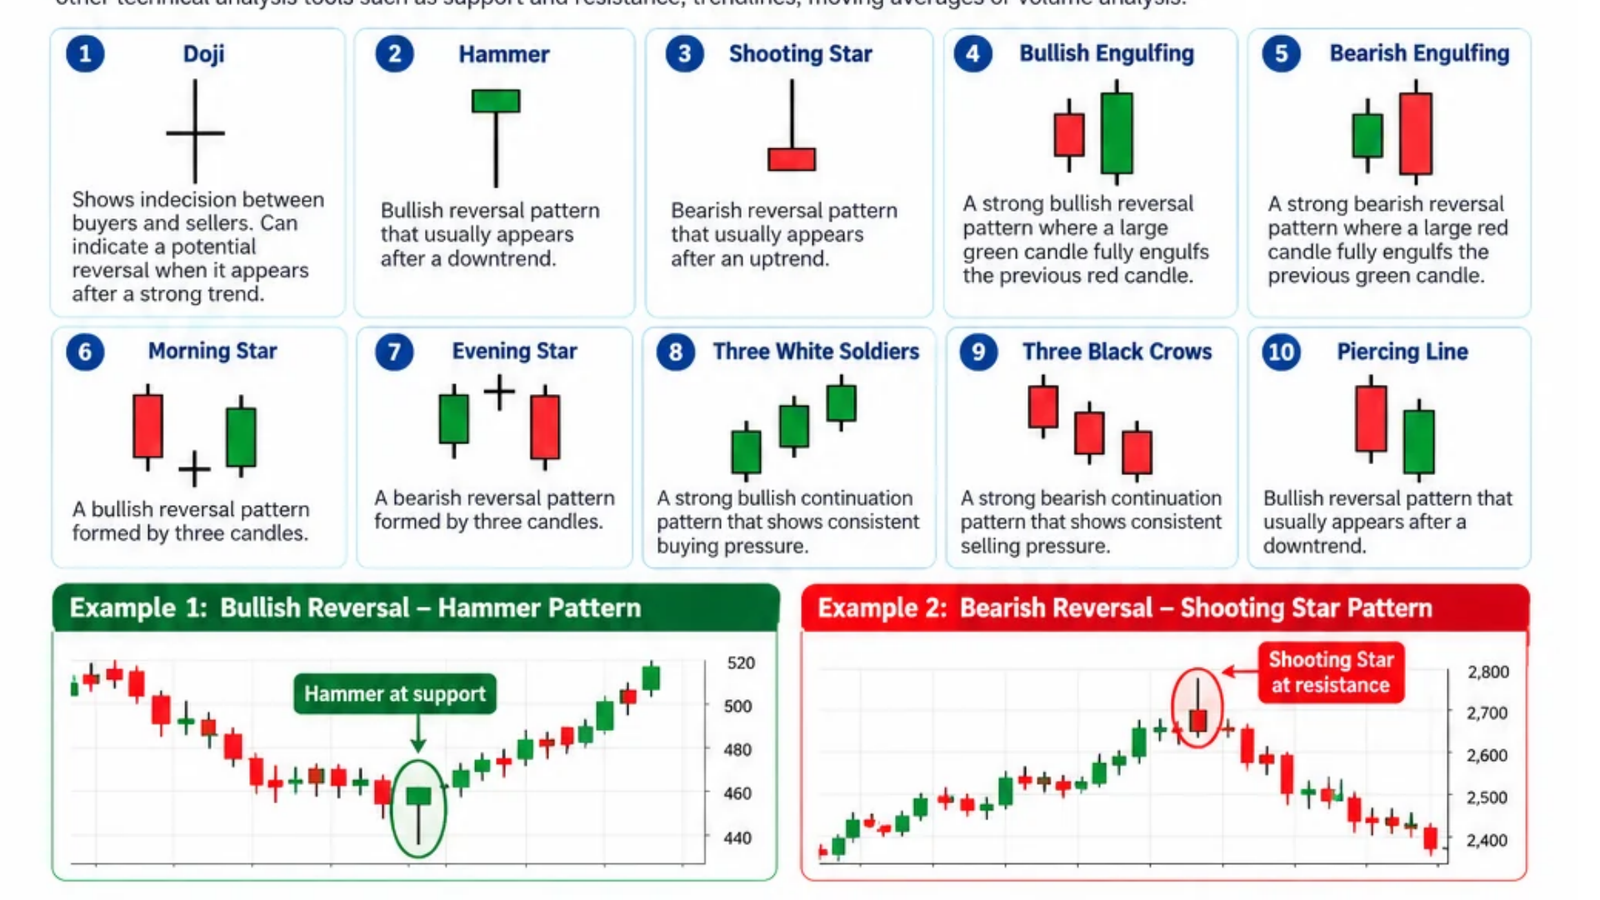
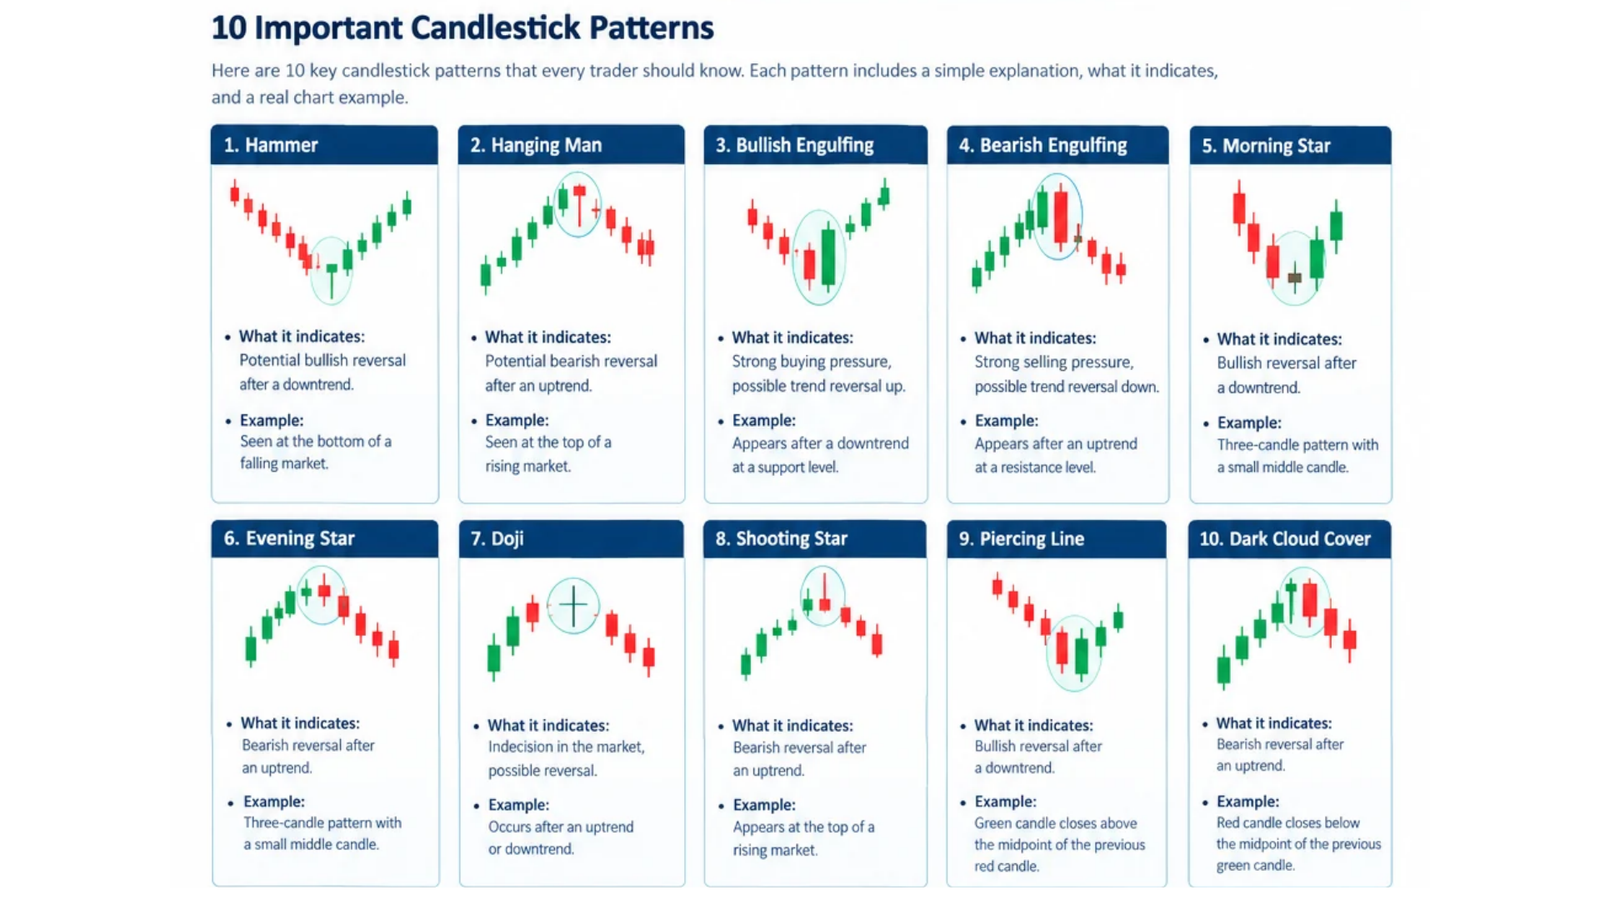
A. Candlestick charts
Candlestick charts show the opening price, closing price, highest price and lowest price during a particular period.
<image-placeholder> </image-placeholder>
The two basic candle types are:
Bullish candle: The closing price is higher than the opening price.
Bearish candle: The closing price is lower than the opening price.
Understanding candlestick patterns helps traders study buying and selling pressure.
B. Support and resistance
Support: A price area where buying interest may emerge and prevent the price from falling further.
Resistance: A price area where selling pressure may emerge and prevent the price from rising further.
For example, if a stock repeatedly finds buying interest around ₹500, that level may act as support.
If it repeatedly struggles to move above ₹520, that level may act as resistance.
These are potential price zones, not guaranteed reversal points.
C. Moving averages
Moving averages help traders understand the general direction of a stock’s price.
Two commonly used moving averages are:
20-period moving average
50-period moving average
For example, a stock trading above its 20-period moving average may indicate short-term strength. However, moving averages are lagging indicators and should not be used alone.
D. Relative Strength Index (RSI)
RSI is a momentum indicator that measures the speed and magnitude of recent price movements.
It generally ranges between 0 and 100.
Above 70: Traditionally considered overbought.
Below 30: Traditionally considered oversold.
These readings do not automatically mean that a stock will reverse direction. Strong trends can remain overbought or oversold for extended periods.
6. Choose the Right Stocks for Intraday Trading
Stock selection is an important part of intraday trading.
Beginners should focus on stocks with sufficient liquidity and trading activity.
Consider these factors:
1. Liquidity
Choose stocks that generally have enough buyers and sellers. Higher liquidity can make it easier to enter and exit positions.
2. Trading volume
Volume indicates the number of shares traded during a particular period. Increasing volume can help confirm the strength of a price movement.
3. Price volatility
Volatility measures how much a stock’s price fluctuates. Extremely volatile stocks can create significant risks for beginners.
4. Market news
Company announcements, earnings results and major economic developments can influence stock prices.
5. Bid-ask spread
The difference between the highest buying price and the lowest selling price is called the bid-ask spread. A very wide spread can increase trading costs.
For beginners, it is better to observe a small watchlist of liquid stocks rather than monitor dozens of stocks simultaneously.
7. Develop a Simple Intraday Trading Strategy
A trading strategy provides a structured approach to entering and exiting positions.
Without a strategy, beginners often make emotional decisions based on sudden price movements.
One educational strategy to study is the breakout trading strategy.
What is breakout trading?
A breakout occurs when a stock moves above a resistance area or below a support area.
For example:
Suppose a stock has been trading between ₹490 and ₹500.
A trader observes that the stock moves above ₹500 with increased trading volume.
The trader may consider a potential buying opportunity if other conditions support the breakout.
An illustrative trading plan could look like this:
| Trading element | Price |
|---|---|
| Entry price | ₹502 |
| Stop-loss | ₹498 |
| Target price | ₹510 |
| Risk per share | ₹4 |
| Potential reward per share | ₹8 |
| Risk-reward ratio | 1:2 |
This means the potential reward is twice the planned risk.
However, a breakout can fail, and the stop-loss may execute at a different price during fast market movements.
Other strategies worth learning include:
Moving average crossover strategy
Support and resistance trading
VWAP-based trading
Price action trading
Opening range breakout strategy
Do not start using multiple strategies simultaneously. Learn one setup, understand its limitations and test it using historical data and paper trading.
8. Understand Risk Management in Intraday Trading
Risk management is arguably more important than finding profitable trading opportunities.
Even an experienced trader can experience losing trades. The objective is to control losses so that one unsuccessful trade does not significantly damage trading capital.
A. Decide your maximum risk per trade
Suppose you have trading capital of ₹20,000.
As an educational example, you decide to risk only 0.5% of your capital on one trade.
Maximum planned risk:
₹20,000 × 0.5% = ₹100
This means your planned loss on that trade should not exceed ₹100, excluding slippage and transaction costs.
B. Calculate position size
Suppose:
Account capital: ₹20,000
Maximum planned risk: ₹100
Entry price: ₹250
Stop-loss price: ₹247
Risk per share: ₹3
Position size:
₹100 ÷ ₹3 = 33 shares (rounded down).
Your total position value would be:
33 × ₹250 = ₹8,250.
If the stop-loss executes at ₹247, the planned loss would be:
33 × ₹3 = ₹99.
This example demonstrates how position sizing can help control trading risk.
C. Always use a stop-loss
A stop-loss is an order or predefined exit level used to limit potential losses.
Never enter a trade without knowing where you will exit if the market moves against you.
D. Set a daily loss limit
Decide how much you can afford to lose in a trading session.
Once that limit is reached, stop trading for the day.
E. Avoid excessive leverage
Leverage allows traders to take larger positions relative to their available capital.
Although it may increase potential returns, it also increases potential losses.
Beginners should avoid using leverage until they fully understand margin requirements, liquidation risks and position sizing.
9. Understand Brokerage Charges and Taxes
Many beginners calculate profits using only the difference between buying and selling prices.
However, actual trading costs reduce the final profit.
Common charges associated with equity intraday trading include:
Brokerage charges
Securities Transaction Tax (STT)
Exchange transaction charges
SEBI turnover fees
GST on applicable services and charges
Stamp duty
Other applicable statutory charges
Example: Calculate net trading profit
Suppose:
Buying price: ₹200
Selling price: ₹205
Quantity: 50 shares
Gross profit: ₹250
Your final net profit will be:
Net profit = Gross profit − Brokerage − Statutory charges − Other applicable costs
Always check your broker’s contract note and charges calculator to understand the actual cost of each transaction.
Income tax considerations
Equity intraday trading without delivery is generally classified as speculative business income under Indian income-tax rules.
Tax treatment, reporting requirements and the treatment of trading losses can depend on your circumstances and the applicable tax law.
Maintain proper records of:
Trading profits and losses
Brokerage and transaction charges
Contract notes
Trading statements
Bank transactions
Consult a qualified chartered accountant for your tax filing and reporting requirements.
10. Practise with Paper Trading Before Using Real Money
One of the biggest mistakes beginners make is entering the stock market with real money before understanding how trading works.
Paper trading allows you to practise buying and selling stocks using virtual money without risking actual capital.
For example, you can create a virtual trading account with ₹50,000 and practise your strategy for 30 trading sessions.
Maintain a trading journal with the following details:
| Trading journal element | Example |
|---|---|
| Date | 02 November 2026 |
| Stock | Example Ltd. |
| Entry price | ₹250 |
| Exit price | ₹255 |
| Quantity | 10 |
| Strategy | Breakout |
| Result | ₹50 gross profit |
| Mistake | Entered without volume confirmation |
Review your trading journal regularly to identify mistakes and improve your decision-making.
Remember that paper trading does not fully reproduce real trading conditions such as emotional pressure, slippage and order execution.
11. Common Intraday Trading Mistakes Beginners Should Avoid
Many beginners lose money because they repeat avoidable mistakes.
Here are some common problems:
1. Trading without knowledge: Learn market basics, charts and risk management before placing trades.
2. Overtrading: Taking too many trades can increase transaction costs and emotional stress.
3. Ignoring stop-losses: Never allow a small planned loss to turn into an uncontrolled loss.
4. Following social media tips blindly: Do your own research and avoid unverified stock recommendations or guaranteed-profit claims.
5. Trading with borrowed money: Avoid using emergency savings, personal loans or money needed for essential expenses.
6. Trying to recover losses immediately: Revenge trading often leads to poor decisions.
7. Changing strategies frequently: Give yourself enough time to understand and evaluate a strategy before switching to another one.
Successful trading education begins with learning from mistakes rather than chasing quick profits.
12. A Practical 30-Day Learning Plan for Beginner Traders
If you are completely new to intraday trading, follow this structured learning plan.
| Period | What to learn | Practical activity |
|---|---|---|
| Days 1–5 | Stock market basics | Learn NSE, BSE, Nifty and Sensex |
| Days 6–10 | Candlestick charts | Study bullish and bearish candles |
| Days 11–15 | Technical analysis | Learn support, resistance and indicators |
| Days 16–20 | Trading strategies | Study one beginner-friendly strategy |
| Days 21–25 | Risk management | Practise stop-loss and position sizing |
| Days 26–30 | Paper trading | Record and review simulated trades |
At the end of 30 days, evaluate your understanding, consistency and ability to follow a trading plan.
Do not treat the completion of this learning plan as proof that you are ready to trade profitably with real money. Continue practising and learning before taking financial risks.
Conclusion
Learning how to start intraday trading in India requires patience, preparation and consistent practice.
As a beginner, your first priority should not be making daily profits. Instead, focus on understanding the stock market, learning technical analysis, developing a trading strategy and protecting your capital through effective risk management.
Start with the basics, practise through paper trading, maintain a trading journal and gradually improve your skills.
Remember, successful trading is not about winning every trade; it is about making informed decisions, controlling losses and following a disciplined process.
If you want to develop your stock market knowledge further, explore our stock trading courses and take the next step towards becoming a more informed and disciplined trader.
Disclaimer: This article is intended solely for educational and informational purposes. It does not constitute investment advice, stock recommendations or a guarantee of returns. Stock market trading involves financial risk, including the possibility of losing your entire trading capital. Consult a qualified financial or tax professional where appropriate.